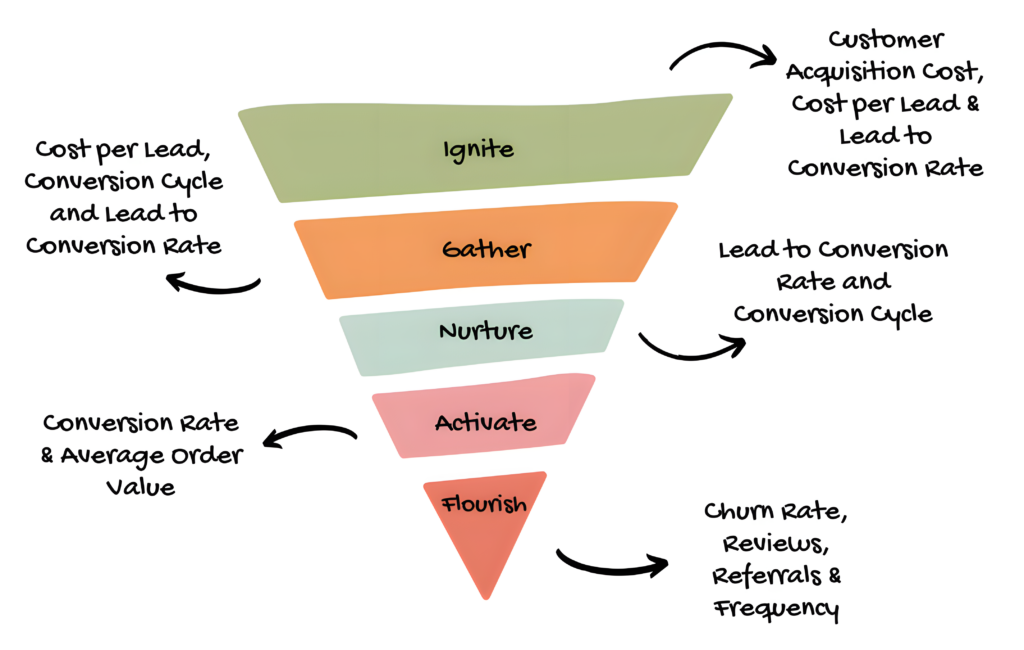
You see each stage has different Key Performance Indicators (KPI) you should must track.
Personally I would only focus on these eleven metrics. (There is one more to track, you’ll see it at the end of this post.)
Of course, you could track dozens more and become lost in a sea of numbers. But that’s not the idea behind tracking KPIs…
The metrics listed here provide all the answers you need to judge how good your marketing is – not based on your gut feelings – but based on numbers.
And, frankly, numbers don’t lie. And honesty is what you need when deciding what to do next, where you can improve and more importantly, it helps you to become a better marketer.
Moreover, it gives you authority among other business owners and marketers who may try to coax you to do this instead of that. It just feels amazing to know the numbers because you can optimize like a genius.
Don’t believe me? Just ask someone what their Conversion Cycle is, or in which channel they have their lowest customer acquisition cost, and you’ll see their helplessness.
So, let’s change that for your case and take a look at all eleven metrics in greater detail, shall we?
Customer Acquisition Cost (CAC)
What is it?
Customer Acquisition Cost (CAC) is the total amount you spend to acquire a new customer. This includes marketing, advertising, sales team salaries, and any other costs directly related to bringing in new business.
Why is it important?
Knowing your CAC helps you understand if you’re spending wisely to grow your business. If your costs are too high, it can cut into your profits. If you’re acquiring customers efficiently, you can scale faster and more sustainably. Keeping track of CAC ensures that your marketing and sales efforts are actually paying off.
How to interpret it
The best way to make sense of CAC is by comparing it to how much a customer is worth to you over time. If your CAC is low, you’re getting new customers efficiently. If it’s too high, you might be spending too much or attracting the wrong customers.
One caveat here! If you have your Lifetime Customer Value under control, then it can be okay to have a high CAC.
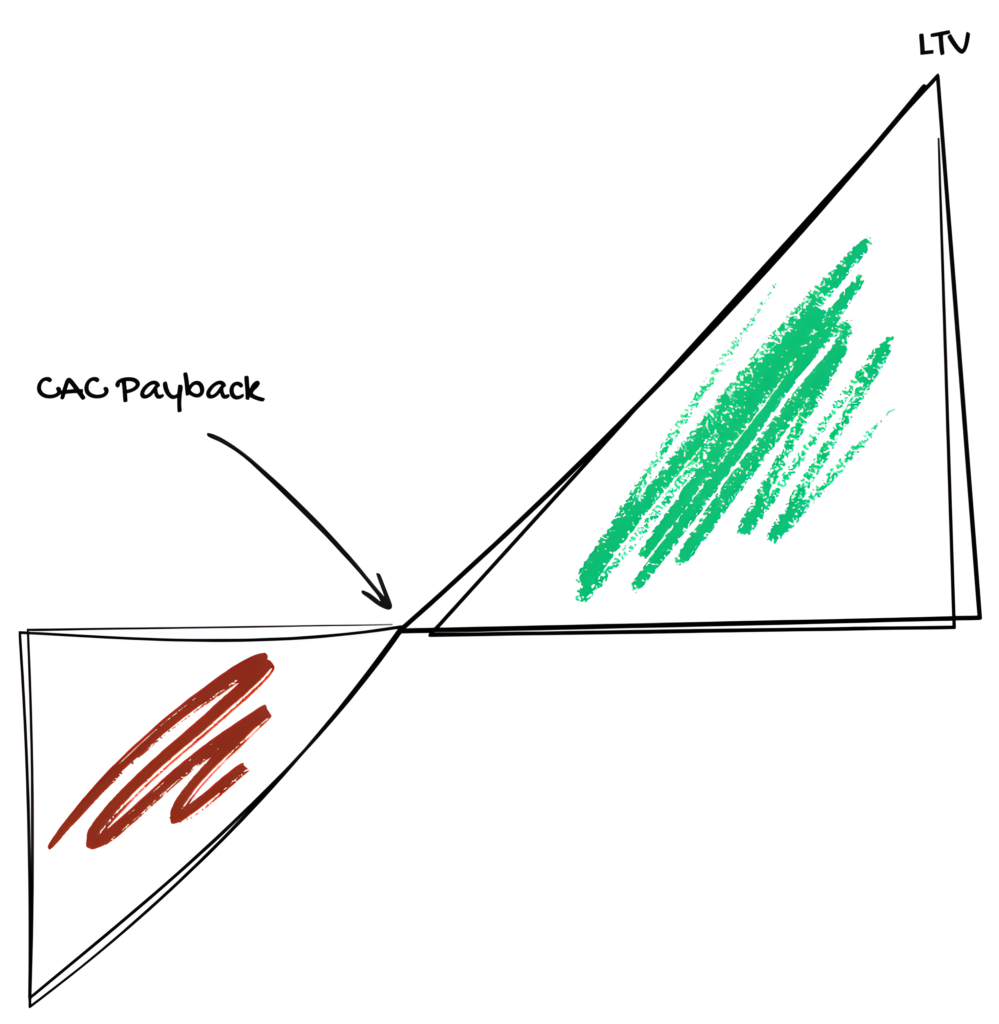
A good rule of thumb is to have a ratio of 3:1. So your LTV should be at least three times your CAC.
How to calculate it
To find your CAC, take your total sales and marketing costs for a period and divide it by the number of new customers you acquired in that same time.
CAC = (Total Marketing and Sales Costs) / (Number of New Customers Acquired)
So, if you spend $10,000 on marketing and sales and acquire 100 new customers, your CAC would be $10,000 / 100 = $100.
Cost per Lead (CPL)
What is it?
CPL is the amount you spend to generate a single lead. A lead is someone who shows interest in your product or service, like a potential customer who fills out a contact form, signs up for a newsletter, or downloads a free resource.
Your CPL includes marketing and advertising costs that contribute to attracting these leads.
Why is it important?
Understanding your CPL helps you measure how effective you are with your lead-generation efforts in the Gather stage. If you’re paying too much for leads, it could mean your ads aren’t targeted well, or you targeted the wrong buyer journey. Hence a low conversion rate but a high CPL.
A lower CPL means you’re getting leads at a better price, making it easier to grow your business without overspending.
How to interpret it
CPL should be looked at in the context of Lead Conversion Rate. If your leads are high-quality and a lot convert into paying customers, a slightly higher CPL might be worth it.
But if you’re spending a lot on leads that don’t convert, you may need to adjust your strategy. Ideally, your CPL should be low enough to keep acquisition costs manageable while still bringing in high-quality leads.
A high CPL isn’t necessarily bad as long as those leads convert efficiently and bring in enough revenue to justify the cost. This is why you need to look at it in the context of your Lead Conversion Rate.
If I track CAC why bother with CPL?
If we go back to the CAC. Your Cost per Lead is a component of the CAC. Don’t confuse these two metrics. The CAC is the full cost of acquiring a customer whereas the CPL tells you how much you spend to get a lead.
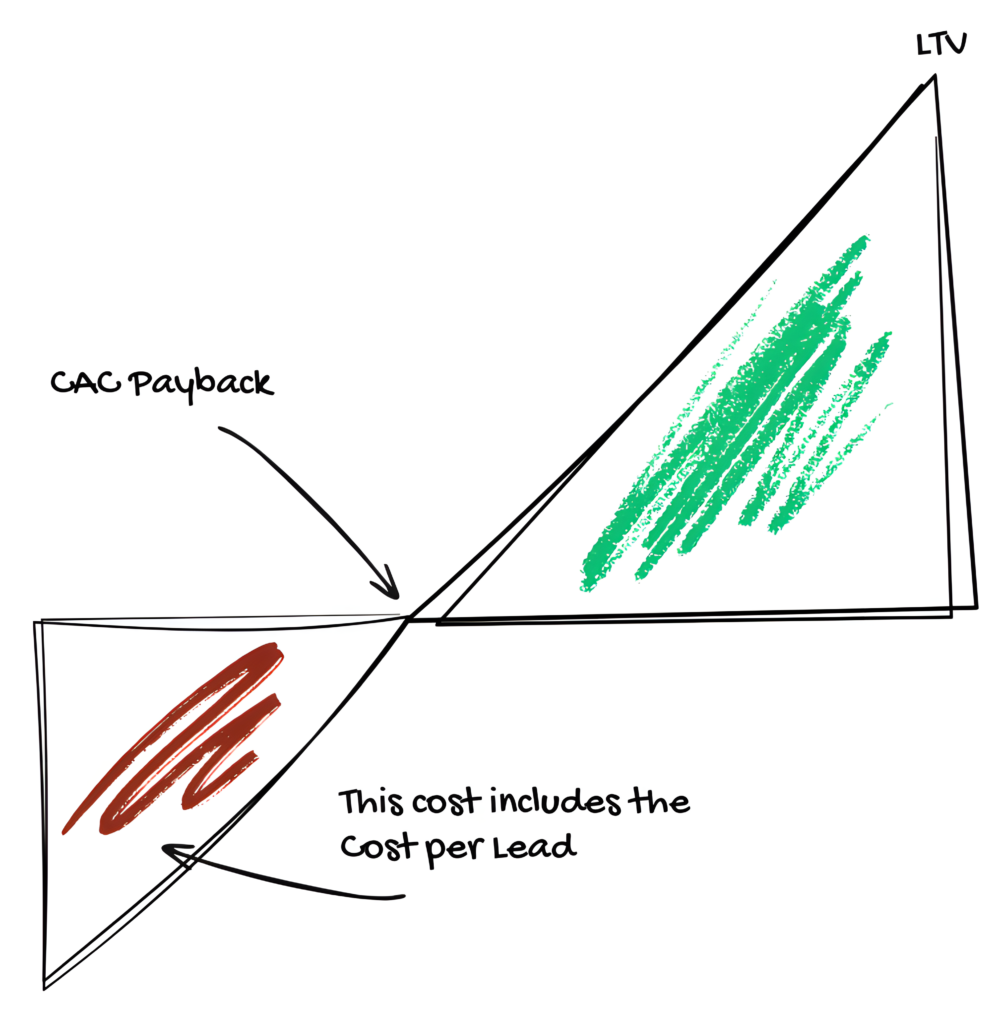
Since not every lead converts into a customer, your total CAC includes CPL but also factors in conversion rates and additional sales costs.
So while CPL is a useful metric, CAC gives you the full picture of what it actually costs to acquire a paying customer.
How to calculate it
To find your CPL, take your total marketing and advertising costs for a period and divide them by the number of leads generated during that time.
Cost Per Lead (CPL) = Total Marketing Spend / Total Number of Leads Generated
So, if you spent $1000 on a marketing campaign and it resulted in 100 leads, your CPL would be $1000 / 100 = $10. This means, on average, you spent $10 to acquire each lead.
Lead to Conversion Rate (LCR)
What is it?
LCR is the percentage of leads that turn into actual paying customers. Not every lead who shows interest in your business will make a purchase, so this metric helps you measure how effective your Nurture stage actually is. And if a specific channel may bring in bad leads or good leads.
Why is it important?
Your LCR tells you how well your business is converting potential customers. A high LCR means your Nurture (follow-up) stage is strong, and you’re attracting the right audience. A low LCR could mean there’s an issue with lead quality, or your follow-up strategy.
Improving your LCR can help you generate more revenue without needing to increase the number of leads.
How to interpret it
If your LCR is high, it means your leads are well-targeted, and your follow-up is working. If it’s low, you might be getting leads that aren’t a good fit, or there may be friction in your follow-up process. Remember, that there are different buyer journeys. You may send emails that would better fit for solution-aware people to problem-aware buyers. Hence, a low LCR.
The key is to ensure your LCR is high enough to justify your marketing spend on acquiring new leads. This is why you need to take a look at this number with your CPL in context.
How to calculate it
To calculate LCR, divide the number of converted leads (customers) by the total number of leads, then multiply by 100 to get a percentage.
Lead to Conversion Rate = (Number of New Customers / Number of Leads) × 100
So, if you had 1000 leads and 250 of them became customers, your Lead to Conversion Rate would be (250/1000) × 100 = 25%. This means you successfully converted 25% of your leads into customers.
Conversion Cycle (CC)
What is it?
The Conversion Cycle (CC) is the average number of days it takes for a lead to become a paying customer. Some leads convert quickly, while others take weeks or even months. This metric helps you understand how long it typically takes for your marketing efforts to translate into revenue.
Why is it important?
Knowing your CC gives you confidence in cash flow planning. If you know that most of your leads convert in 30 days, you can predict when revenue will come in and plan your marketing budget accordingly.
Different marketing channels may have different CCs some leads buy almost immediately, while others take longer to decide. Understanding this can help you optimize your marketing efforts and forecast revenue more accurately.
So if you need cash desperately you know where to invest your marketing dollars for the fastest revenue.
How to interpret it
A short CC means your leads are converting quickly, which is great for cash flow and business growth. A long CC may indicate that your follow-up process requires multiple touchpoints.
This isn’t necessarily bad (if you have a free trial e.g. of 30 days, or a higher-priced product that needs more “education”), but it’s important to ensure that a long CC still leads to profitable conversions. Comparing CC across different channels can also show you which sources bring in faster-converting customers.
How to calculate it
To calculate CC, take the total number of days in a given period (the start of them becoming a lead and the day the purchase) and divide it by the total number of customers generated during that time.
Conversion Cycle (CC) = Total Days of All Leads / Total Number of Customers
For example, you have generated 200 leads, and in total the time of becoming a lead, till the first purchase was 600 days. Sixty of these leads became customers. Your CC would be 600 / 60 = 10 days.
This means, on average, it takes 10 days for a lead to become a customer. Yes, it may be tiresome to track for all leads the day they became a lead and the day the purchased their first product, yet it’s worth it.
Conversion Rate (CR)
What is it?
Conversion Rate (CR) is the percentage of people who take a desired action, such as making a purchase, signing up for a service, or completing a form. It measures how effective your marketing and sales efforts are at turning visitors or leads into customers.
Why is it important?
CR is one of the most important metrics for any business because it directly impacts revenue. A higher CR means you’re getting more value from your traffic without needing to spend more on marketing.
If your CR is low, it could indicate issues with your website, sales copy, or targeting. Optimizing CR can help you grow your business more efficiently.
How to interpret it
A high CR means your marketing and sales efforts are working well, and you’re successfully turning visitors into customers.
A low CR suggests there might be friction in your process perhaps your landing page isn’t persuasive, your offer isn’t compelling, or your checkout process is too complicated, or you simply target the wrong people. The wrong buyer journey, wrong messaging etc.
How to calculate it
To calculate CR, divide the number of conversions (e.g., purchases, sign-ups) by the total number of visitors or leads, then multiply by 100 to get a percentage.
Conversion Rate (CR) = (Amount of Conversions / Number of People Who Purchased) × 100
So, if your sales page had 1,000 visitors from the email campaign and 50 of them made a purchase, your conversion rate would be (500 / 1,000) × 100 = 5%.
Average Order Value (AOV)
What is it?
Average Order Value (AOV) is the average amount a customer spends per order. It helps you understand how much revenue you generate from each transaction, rather than just focusing on the number of sales.
Why it is important?
AOV plays a big role in your revenue and profitability. A higher AOV means you’re making more money per customer without needing to acquire more buyers. If you can increase your AOV, you can grow your revenue without increasing your marketing spend.
Strategies like upselling, bundling products, or offering free shipping on higher value orders can help boost AOV.
How to interpret it
If your AOV is high, it means customers are spending more per transaction, which is great for profitability. If it’s low, you may need to encourage customers to buy more per order by offering product recommendations, discounts for larger purchases, or bundling items.
How to calculate it
To calculate AOV, divide your total revenue by the number of orders over a given period.
Average Order Value (AOV) = Total Revenue / Number of Transactions
For example, if your online store generated $10,000 in revenue from 200 transactions, the AOV would be $10,000 / 200 = $50. This means that, on average, customers spend $50 each time they shop at your online store.
Churn Rate (CR)
What is it?
Churn Rate (CR) is the percentage of customers who stop using your product or service over a given period. It’s especially important for subscription-based businesses but applies to any company that relies on repeat customers – which is nowadays important for almost any company.
Why is it important?
Churn Rate directly affects your revenue and growth. If too many customers leave, you’ll have to spend more on acquiring new ones just to maintain your business. A high churn rate can signal problems with customer satisfaction, product value, or competition.
How to interpret it
A low churn rate is a good sign it means customers are sticking with your business. A high churn rate could mean your customers aren’t satisfied, finding better alternatives, or not seeing enough value in your product.
You must take this metric into the context of your product. If you sell weight-loss supplements, and you have a churn rate after e.g. 90 days that can be normal. Your customers have lost the weight and thus no longer need the supplement.
How to calculate it
To calculate Churn Rate, divide the number of customers lost during a period by the total number of customers at the start of that period, then multiply by 100 to get a percentage.
Churn Rate = (Number of Customers at the Start of the Period – Number of Customers at the End of the Period) / (Number of Customers at the Start of the Period) × 100
So, if you started the month with 200 customers and ended the month with 180 customers, your churn rate would be ((200-180)/200) × 100 = 10%.
This means that you lost 10% of your customers during that period.
Review Rate (RVR)
What is it?
Review Rate (RVR) is the percentage of customers who leave a review. It helps measure how engaged and satisfied your customers are and how willing they are to share their experiences.
Why is it important?
Customer reviews play a huge role in building trust and influencing potential buyers. A high RVR means your customers are actively sharing feedback, which you can use for social proof. And social proof always trumps what you say about yourself.
If your RVR is low, you might need to encourage more reviews through follow-up emails that offer incentives in exchange of a feedback, discounts for example.
How to interpret it
A high RVR suggests that your customers are engaged and willing to provide feedback, which can be a strong sign of customer satisfaction. A low RVR may indicate that customers are either indifferent or find the review process too complicated. Tracking RVR helps you understand how well you’re encouraging customer feedback and where you might need to improve.
How to calculate it
To calculate Review Rate, divide the number of reviews received by the total number of customers in a given period, then multiply by 100 to get a percentage.
Review Rate = (Amount of Reviews / Number of Customers) × 100
For example, if you had 1,000 customers in a month and received 50 reviews, your RVR would be: (50 / 100) × 100 = 5%. This means 5% of your customers left a review.
Referral Rate (RFR)
What is it?
Referral Rate (RFR) is the percentage of your customers who refer new customers to your business. It measures how often people recommend your product or service to others, often through word of mouth, referral programs, or social sharing.
Why is it important?
Referrals are one of the most cost-effective ways to acquire new customers. A high RFR means your customers love your product and are actively promoting it, which can lead to organic growth with minimal marketing spend. If your RFR is low, you may need to improve your product experience or create incentives for referrals.
How to interpret it
A high RFR means customers are excited about your brand and willing to share it with others. A low RFR could indicate that customers like your product but don’t feel motivated to recommend it. Tracking RFR helps you understand how strong your word-of-mouth marketing is and whether your referral incentives are effective.
How to calculate it
To calculate Referral Rate, divide the number of customers who referred at least one new customer by the total number of customers in a given period, then multiply by 100 to get a percentage.
Referral Rate = (Amount of Referrals / Number of Customers) × 100
For example, if you have 1,000 customers in a month and 50 of them refer at least one new customer, your RFR would be: (50 / 100) × 100 = 5%. This means 5% of your customers referred someone new.
Purchase Frequency (PF)
What is it?
Purchase Frequency (PF) is the average number of times a customer makes a purchase within a specific time period. It shows you how often your customers come back to buy from you, providing insight into customer engagement and loyalty.
Why is it important?
Understanding PF is important because it helps you gauge customer loyalty and the effectiveness of your retention strategies. When you know how often customers purchase, you can better plan inventory, adjust marketing efforts, and forecast revenue. It also allows you to see which customer segments are most engaged and where you might need to work on increasing repeat purchases.
How to interpret it
A high Purchase Frequency indicates that your customers find value in your product or service and are likely satisfied with their experience. On the other hand, a low PF suggests that customers might not be returning as often as you would like, which could signal the need for better customer engagement or loyalty programs.
Monitoring PF over time can help you assess the impact of changes in your marketing strategy or product offerings.
How to calculate it
To calculate PF, divide the total number of purchases by the total number of unique customers during a given period. For example, if you have 1,000 purchases from 250 customers in a month, your PF would be:
Purchase Frequency = (Amount of Purchases / Number of Unique Customers)
For example, if you have 1,000 purchases from 250 customers in a month, your PF would be: (1,000 / 250) = 4.
This means that, on average, each customer makes 4 purchases in that month. This number can help you plan promotions, manage stock, and optimize your overall customer experience.
Lifetime Value (LTV)
What is it?
Lifetime Value (LTV) is the total revenue a customer is expected to generate for your business over the entire duration of their relationship with you. It helps you understand how valuable a customer is beyond just a single purchase.
Why is it important?
LTV is crucial because it helps you determine how much you can afford to spend on acquiring and retaining customers while staying profitable. A high LTV means your customers make repeat purchases and stay loyal to your brand, which leads to sustainable growth.
If your LTV is too low compared to your Customer Acquisition Cost (CAC), you may need to focus on increasing repeat purchases (PF), improving Average Order Value (AOV) or reducing acquisition costs by testing different channels. What also can help is to increase the Referral Rate (RFR) to get more customers for free.
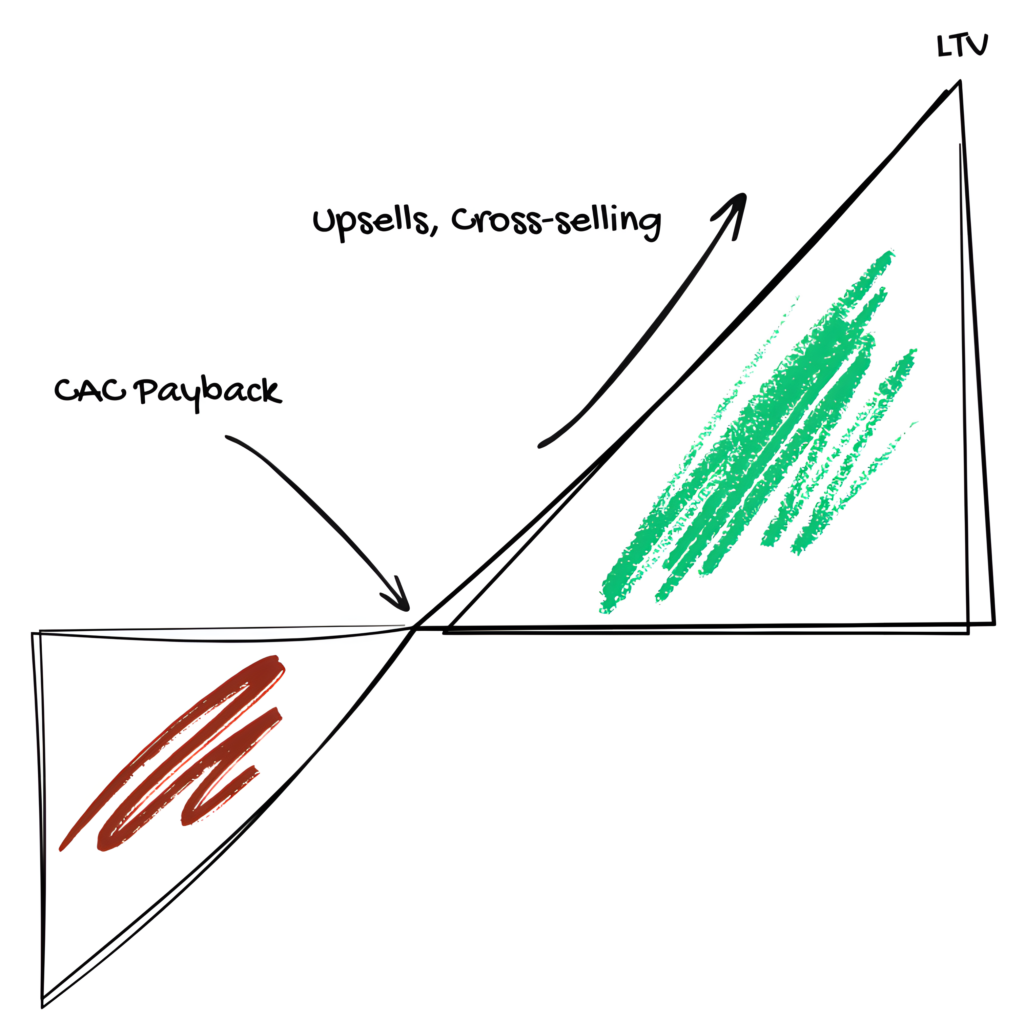
How to interpret it
A high LTV indicates strong customer loyalty, repeat business, and effective strategies in the Flourish stage. A low LTV suggests that customers either don’t return often or don’t spend much per order. By increasing LTV, you can maximize revenue without constantly needing to acquire new customers. Strategies like upselling, cross-selling, loyalty programs, and excellent customer service can help boost LTV.
How to calculate it
To calculate LTV, multiply Average Order Value (AOV) by Purchase Frequency (PF) and then multiply by Customer Lifespan (CL) (the average time a customer stays active with your business).
LTV = AOV × PF × CL
For example, if you have:
- AOV = $50 (average spent per order)
- PF = 4 (purchases per year)
- CL = 3 years (average customer lifespan)
your LTV would be 50 × 4 × 3 = $600. This means the average customer is worth $600 over their lifetime (3 years).
You know you can spend up to $600 to acquire a customer and you’d break-even. Of course, you wouldn’t want to spend so much but what about $100? You know in the first year you will earn $200. So the acquisition cost is covered.
Knowing this number gives you power to invest smartly.
Return on Ad Spend (ROAS)
What is it?
Return on Ad Spend is the revenue earned for every dollar spent on advertising. You can think of it like a scorecard for your advertisement campaign. It shows you how good (or bad) your ad dollars have worked for you.
Why is it important?
You use it primarily for strategic decisions. How? It shows you immediately how good your ad has performed. You see if the ad has made enough revenue or not, at a simple glance. So, you can identify which campaign are most profitable and which can be tossed in the trash.
How to interpret it?
If the calculated ROAS is >1 then you’re earning more than you’re spending. Great job! With =1 you are breaking even. And with <1, well you’re losing money on ads.
A ROAS of 4.0 means you earn $4 in revenue for every $1 spent on advertising. But, a good ROAS always depends on your profit margins. A ROAS of 2 might be great for a high-margin business but unprofitable for a low-margin one.
So, like many other KPIs here, the big picture matters. ROAS tells you how the ad has performed in contrast to the spending, but it doesn’t know how much it cost you build this product. For this you may add COGS (Cost of Goods Sold) to the ad spend. COGS includes all direct costs of this product: manufacturing costs, material overhead, etc.
Plus, you may also add shipping cost per product to this sum. To really understand how good this ad campaign was for you, profit-wise.
How to calculate it?
To calculate your ROAS you simple divide the revenue from your ad through the cost of this ad. For example, if you spend $1,000 and generated $5,000 in revenue, then your ROAS would be $5,000 / $1,000 = 5.
That means for every $1 spent, you made $5 back.
Leave a Reply